Simplifying the Understanding of Advanced Attribution
What is Attribution? Oxford defines it as:
The action of regarding something as being caused by a person or thing. “the electorate was disillusioned with his immediate attribution of the bombings to a separatist group”
Attribution in media? Tracking which media channels that make the biggest impact in customer engagement and ultimately sales.
AD → AD 2 → AD 3 → Website → AD 5 → Conversion
In most of advertising, it is commonplace that the default is last touch/click. Whichever channel grabs that person’s attention. That is where most of the value of the conversion should go to. Google makes BOAT TONNES of money based on this notion. Facebook does exactly the same. As digital has grown, the subsequent metrics have grown over the years to better ‘quantify’ performance in order to have advertisers spend more money in said product. It’s honestly sad that teams at various agencies, media teams at fortune 500 companies still have yet to fully adopt the notion that all media performance cannot be compared apple to apples.
Some teams have leveraged advanced consumer journey mapping, some have tried using alternative metrics to prove out more ‘quality’ leads, some teams have attempted at advanced attribution via Markov chains or Bayesian theory, some teams have toyed around with the attribution models provided by Google and Facebook (side note: one must ask if it’s worth letting someone grade their own homework despite them saying they aren’t but I digress). At the end of the day, all attribution models are flawed to an extent. There are so many several assumptions that need to be made in order to capture the widest lens of attribution; methodology, tagging, platform limitations (duh!), additional blindspots, media channels run, offline channels etc.
I personally only have had experiences with a handful of a different attribution partners and I do have a preference due to the methodology. C3 Metrics is my preferred partner given that they leverage Bayesian Theory (think imitation game) to assign and fractionalize credit amongst all the media channels that are run.
As far as how attribution is calculated, consider this example using football or as most American’s refer to it as Soccer, Liverpool FC’s “pitch control”
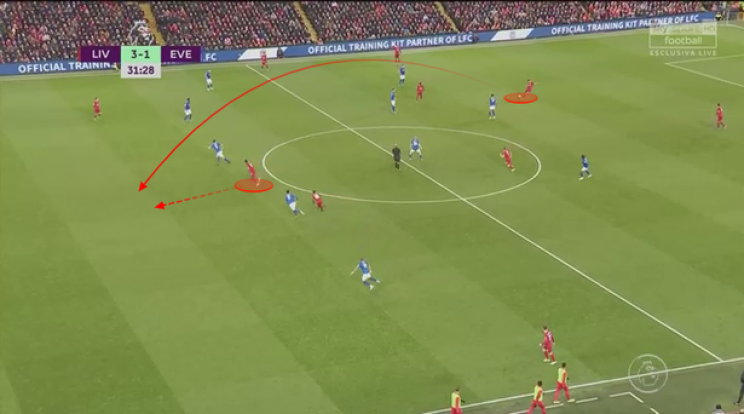
Source: Liverpool FC
In this screenshot, you have the centre-back pushing the ball up to the forward. The forward then has options: Pass, shoot, or get the ball taken away from. Bear with me in the following scenarios:
- After the centre-back passes it to up the pitch. If the forward takes the ball and then shoots and scores.
- There are 2 touch points here.
- Under a last touch attribution (LTA) model, the striker gets entirety of credit. He made their scoresheet go from 3 to 4!
- Under a multi-touch attribution (MTA) model, the striker splits the goal with the assist from the defender. Each would get 50% of the credit
- After the centre-back passes it up the pitch, the striker then decides to pass it to the left wing, the left wing then shoots and scores.
- There are 3 touch points here.
- Under the LTA model, the left wing gets the entirety of the credit.
- Under a MTA model, the left wing scores, while the striker gets the assist, and the centre-back also plays an integral role to start the action. The goal then would be fractionalized. Left wing gets 50%, striker gets 30%, centre-back gets 20%
- Depending on the MTA model being leveraged, the fractionalized conversions can be weighted differently based on impact of each touch point.
- After the centre-back passes it up the pitch, the striker then decides to pass it to the left wing so that he can run up in space to get a better shot and then the left wing passes it back to the striker and it’s a tap in score.
- There are 5 touch points here
- Under the LTA model, the striker gets the goal and entire credit of the credit
- Under a MTA model; The striker touches the ball twice. It would still count as two touch points despite the outcomes being different. The model then would access said touch point to be weighted slightly higher given the level of impact. Or potentially the left wing gets more credit because the ‘play’ on ball is more critical to set up the striker for the final touch point. The weighting would potentially be fractionalized as follows; centre-back gets 15%, striker gets 45%, left wing gets 40% of the credit
- The goalie passes to the centre-back who passes it up the pitch, the striker then decides to pass it to the left wing so that he can run up in space to get a better shot and then the left wing passes it back to a midfielder, then back to the goalie to reopen up the pitch. The first scenario recycles.
- There are 8 touch points here.
- Under the LTA, striker gets 100% of goal
- Under a MTA model; similar to the last scenario, there are several actions that ultimately lead to the goal but it was more nuanced than the striker just scoring. Each touch point would then be weighted differently because of the additional actions. The repeating actions for certain individuals such as the centre-back or goalie would allow those touch points to be weighted more heavily compared to the mid-fielder or left wing.
These scenarios as it relates to MTA are meant to prove out the nuances that attribution is not simply black and white as it often is made out to be. Each touch point is valuable in some capacity because it’s a mark within the consumer journey. By pushing to understand some of these insights, the mechanics, the blindspots. It’ll lead to better planning, better measurement, better use of media dollars, and ultimately closer to the right version of the truth (championship) that can be bought into by the organization.